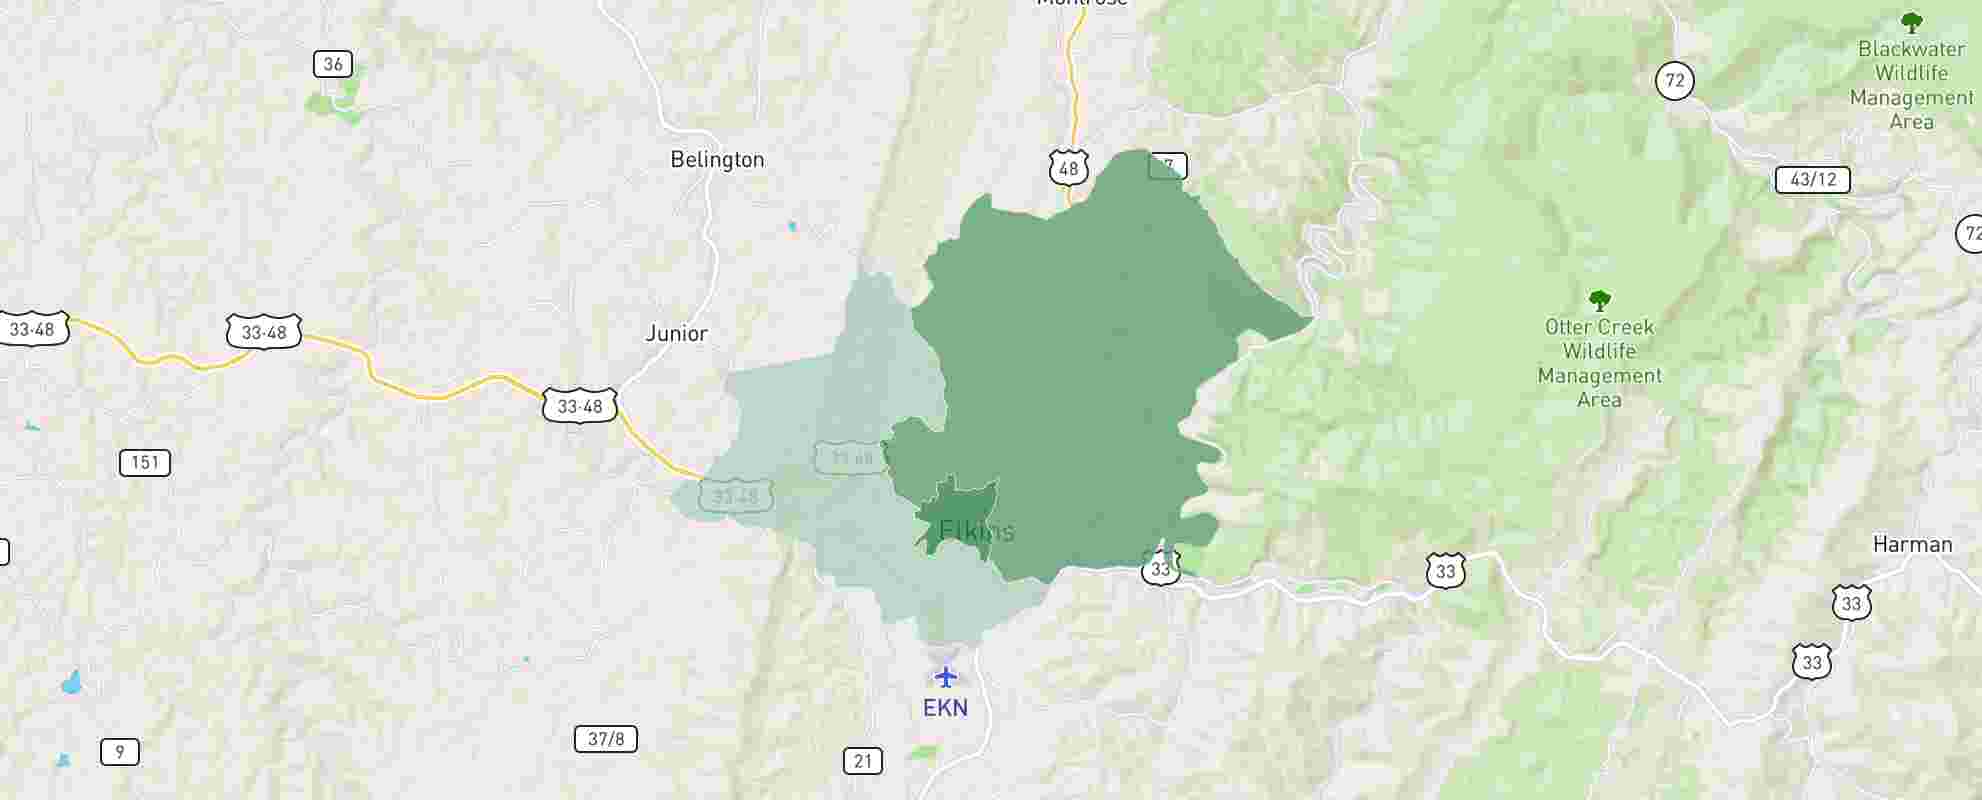
Data on this report is based on areas within the legal city boundary, outlined in black on the map. Any additional neighborhoods shown on the map are associated with the city by name and are included for reference only.
With a population of 6,755, 2,706 total housing units (homes and apartments), and a median house value of $199,004, house prices in Elkins are solidly below the national average.
Single-family detached homes are the single most common housing type in Elkins, accounting for 64.58% of the city's housing units. Other types of housing that are prevalent in Elkins include duplexes, homes converted to apartments or other small apartment buildings ( 17.24%), large apartment complexes or high rise apartments ( 8.81%), and a few row houses and other attached homes ( 5.12%).
The most prevalent building size and type in Elkins are three and four bedroom dwellings, chiefly found in single-family detached homes. The city has a mixture of owners and renters, with 59.46% owning and 40.54% renting.
The housing in Elkins was primarily built before 1939 ( 38.29%), making the housing stock in Elkins some of the oldest overall in America, although there is a range of ages of homes in Elkins. The next most important housing age is between 1940-1969 ( 30.51%), followed by between 1970-1999 ( 23.92%). There's also some housing in Elkins built between 2000 and later ( 7.27%).
Vacant housing appears to be an issue in Elkins. Fully 19.99% of the housing stock is classified as vacant. Left unchecked, vacant Elkins homes and apartments can be a drag on the real estate market, holding Elkins real estate prices below levels they could achieve if vacant housing was absorbed into the market and became occupied. Housing vacancy rates are a useful measure to consider, along with other things, if you are a home buyer or a real estate investor.
Elkins Home Appreciation Rates
Elkins's appreciation rate notably has been below the national average for the last ten years. The average annual home appreciation rate in Elkins during the period has been just 4.95%, which is lower than 80% of US communities.
Appreciation rates are so strong in Elkins that despite a nationwide downturn in the housing market, Elkins real estate has continued to appreciate in value faster than most communities. Looking at just the latest twelve months, Elkins appreciation rates continue to be some of the highest in America, at 10.41%, which is higher than appreciation rates in 86.85% of the cities and towns in the nation. Based on the last twelve months, short-term real estate investors have found good fortune in Elkins. Elkins appreciation rates in the latest quarter were at 4.86%, which equates to an annual appreciation rate of 20.90%.
Importantly, this makes Elkins one of the highest appreciating communities in the nation for the latest quarter, and may signal the city's near-future real estate investment strength.
Relative to West Virginia, our data show that Elkins's latest annual appreciation rate is higher than 60% of the other cities and towns in West Virginia.
Average Home
Values
Average Home Values
Median home value is the value which has equal numbers of homes valued above and below it. The median home value is more stable than the average home value, which can be greatly affected by a few very high or very low home values.
Median Home Value
$199,004
Elkins, WV Home Prices
> $1,379,000
$1,035,001 - $1,379,000
$690,001 - $1,035,000
$552,001 - $690,000
$414,001 - $552,000
$276,001 - $414,000
$138,001 - $276,000
$69,001 - $138,000
$0 - $69,000
0.1%
0.1%
0.0%
0.0%
4.6%
4.6%
1.0%
1.0%
2.9%
2.9%
17.4%
17.4%
39.5%
39.5%
22.2%
22.2%
12.3%
12.3%
0%
100.0%
% of Homes
High
for West virginia
Low
for nation
Number of Homes And Apartments:
2,706
Elkins Appreciation
Rates
Appreciation Rates
NeighborhoodScout's® Exclusive Home Appreciation Rates
NeighborhoodScout reveals the home appreciation rates for every city, town,
and even most neighborhoods in America.
NeighborhoodScout has calculated and provides home appreciation rates as a
percentage change in the resale value of existing homes in that city, town
or neighborhood over the latest quarter, the last year, 2-years, 5-years,
10-years, and even from 2000 to present. We show both the cumulative
appreciation rate, and the average annual appreciation rate for each time
period (e.g., last 5-years: 84% total appreciation, Avg. per year: 16.8%).
We also show how each city, town or neighborhood's appreciation rate compares
to other cities, towns and neighborhoods in the nation, and within the same
state (e.g., 9 relative to the nation, 5 relative to California [10 is highest]).
This makes comparisons of house appreciation rates equally easy for professional
investors and individual homebuyers. In this example, the neighborhood is
one of the highest appreciating in the nation over the last 5-years, but is
only average in appreciation for the same period relative to other neighborhoods
in the state of California.
About the appreciation rate data
Our data are designed to capture changes in the value of single-family homes
at the city, town and even the neighborhood level. Different neighborhoods
within a city or town can have drastically different home appreciation rates.
NeighborhoodScout vividly reveals such differences. Our data are built upon
median house values in each neighborhood, and combine data from the United
States Bureau of the Census with quarterly house resale data. The data
reflect appreciation rates for the neighborhood overall, not necessarily
each individual house in the neighborhood.
Our data are calculated and updated every three months for each neighborhood,
city and town, approximately two months after the end of the previous quarter.
Each quarter, Fannie Mae and Freddie Mac provide their most recent mortgage
transactions to the FHFA. These data are combined with the data of the
previous 29 years to establish price differentials on properties where more
than one mortgage transaction has occurred. The data are merged with
neighborhood-specific median house values from the Census Bureau using
NeighborhoodScout's proprietary algorithms developed by Dr. Schiller,
creating an updated historical database that is then used to estimate the
appreciation rates for each city, town and neighborhood within each time
period. These resultant neighborhood appreciation rates are a broad measure
of the movement of single-family house prices. The appreciation rates serve
as an accurate indicator of house price trends at the neighborhood level.
How is the home appreciation data calculated?
Neighborhood appreciation rates from NeighborhoodScout are based on both
median house value data reported by respondents via the U.S. Bureau of the
Census, and a weighted repeat sales index, meaning that they measure average
price changes in repeat sales or refinancings on the same properties. This
information is obtained by reviewing repeat mortgage transactions on
single-family properties whose mortgages have been purchased or securitized
by Fannie Mae or Freddie Mac (by the FHFA). Then proprietary algorithms
developed by Dr. Schiller, NeighborhoodScout's founder, are applied
to produce neighborhood appreciation rates. Appreciation rates are updated
by NeighborhoodScout each quarter as additional mortgages are purchased or
securitized by Fannie Mae and Freddie Mac. The new mortgage acquisitions
are used to identify repeat transactions for the most recent quarter, then
are fed into NeighborhoodScout's search algorithms.
What transactions are covered in the appreciation rate data?
Neighborhood appreciation rate data are based on transactions involving
conforming, conventional mortgages. Only mortgage transactions on single-family
properties are included. Conforming refers to a mortgage that both meets
the underwriting guidelines of Fannie Mae or Freddie Mac and that doesn't
exceed the conforming loan limit, a figure linked to an index published by
the Federal Housing Finance Board. Conventional means that the mortgages
are neither insured nor guaranteed by the FHA, VA, or other federal government
entity.
Mortgages on properties financed by government-insured loans, such as FHA
or VA mortgages, are excluded, as are properties with mortgages whose principal
amount exceeds the conforming loan limit. Mortgage transactions on condominiums
or multi-unit properties are also excluded. As such, NeighborhoodScout does
not produce appreciation rates for neighborhoods that consist solely of
renters or have no single-family homes (dwellings without an entrance directly
to the outside).
Time Period
Total Appreciation
Average Annual Rate
Compared To
WV
Compared To
America
Latest Quarter:
2024 Q3 - 2024 Q4
4.86%
20.90%
9
10
Last 12 Months:
2023 Q4 - 2024 Q4
10.41%
10.41%
7
9
Last 2 Years:
2022 Q4 - 2024 Q4
18.18%
8.71%
8
7
Last 5 Years:
2019 Q4 - 2024 Q4
54.72%
9.12%
8
5
Last 10 Years:
2014 Q4 - 2024 Q4
62.04%
4.95%
4
2
Since 2000:
2000 Q1 - 2024 Q4
144.97%
3.65%
6
4
* 10 is highest
Rent &
Ownership
Rent & Ownership
Average Market Rent
Average market rent is exclusively developed by NeighborhoodScout. It reveals the average monthly rent paid for market rate apartments and rental homes in the city, excluding public housing. Utility payments are not included.
Homeownership Rate
The percentage of housing units in the city that are occupied by the property owner versus occupied by a tenant (Vacant units are counted separately).
Average Market Rent:
$1,362
/ per month
Homeownership Rate
Owners
Renters
59.5%
59.5%
40.5%
40.5%
0%
100.0%
% of Homes
Vacancy Rate
Vacant
Occupied
20.0%
20.0%
80.0%
80.0%
0%
100.0%
% of Homes
Housing Market
Details
Housing Market Details
Age of Homes
The proportion of homes and apartments in the city built within a certain time period.
Type of Homes
These are the predominate forms of housing in the city. Percentages are based on the number of housing units for each type over the total number of units across all types.
Size of Homes
The predominate size of homes in the city based on the number of bedrooms. Homes include single family houses as well as apartment and condominium units.