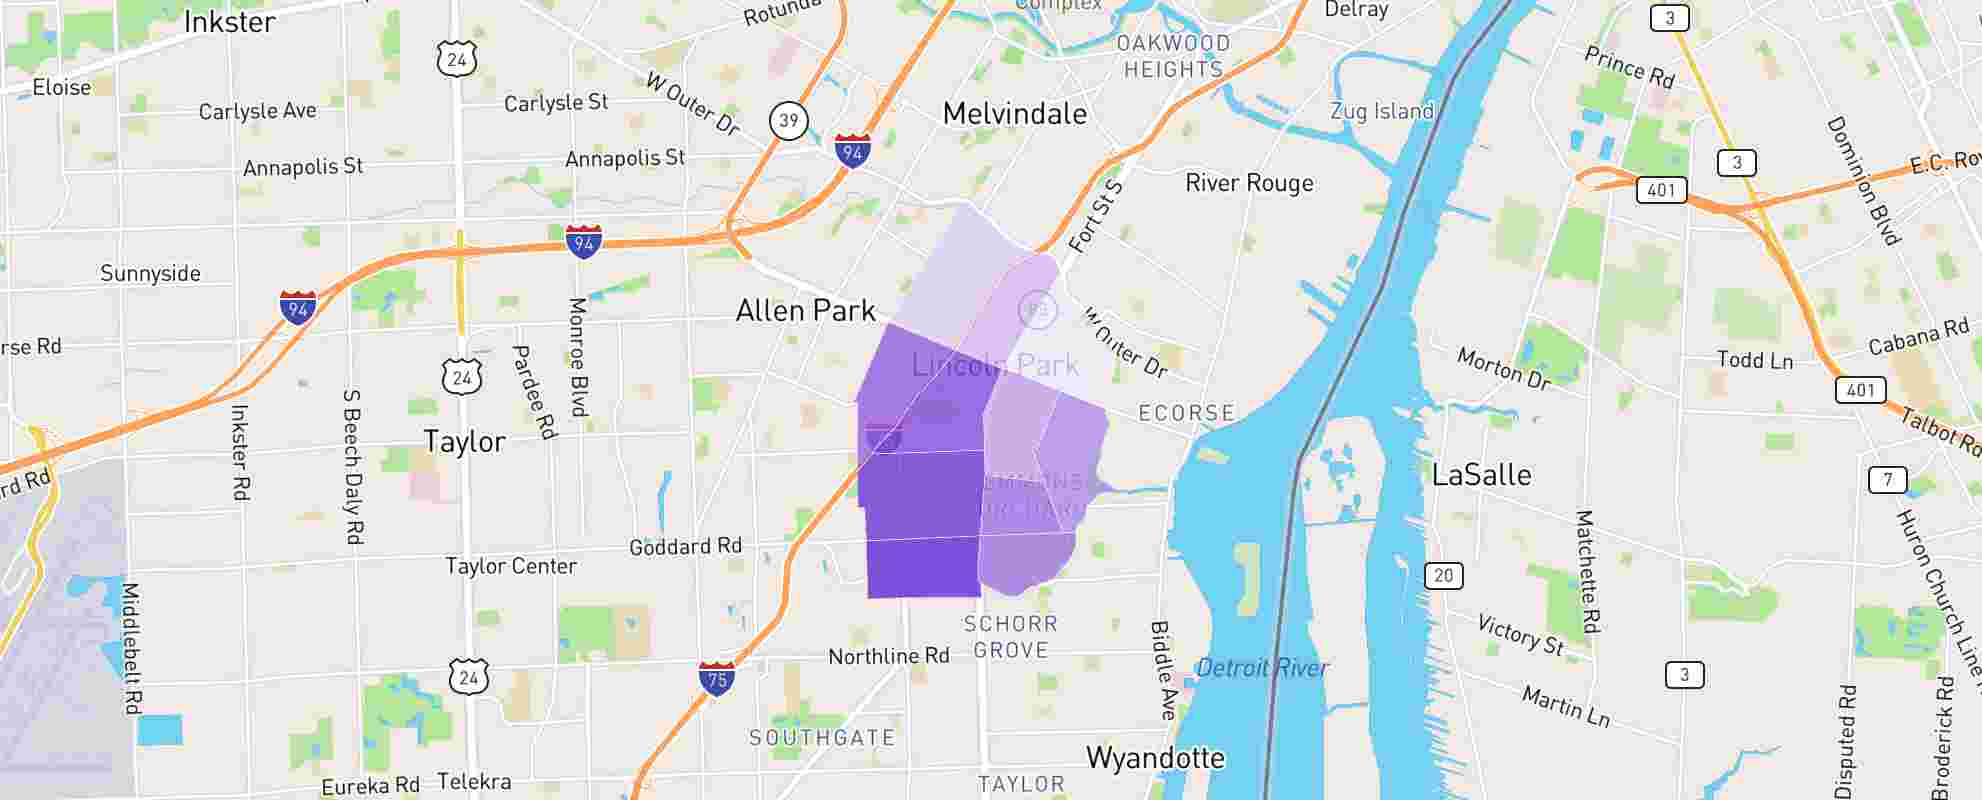
Data on this report is based on areas within the legal city boundary, outlined in black on the map. Any additional neighborhoods shown on the map are associated with the city by name and are included for reference only.
Methodology:
Only NeighborhoodScout gives you nationally comparable school ranks based on test scores, so you can directly compare the quality of schools in any location.
Read more about Scout's School Data
The Only Nationally Comparable School Quality Ratings Available Today
U.S. Patent 8,376,755 by NeighborhoodScout®
NeighborhoodScout® has developed the first ever nationally comparable school ratings.
The result? - neighborhood educational ratings that facilitate accurate comparison among schools, school districts, and neighborhoods in the same (or different) cities, and even between schools in different states.
It is well known that the quality of education provided by public schools varies greatly from school district to school district, and from city to city. Still further, the quality of a child's education can vary significantly from neighborhood to neighborhood within any city or town.
Lincoln Park School District Of The City Of School District details
Lincoln Park School District Of The City Of School District
1650 Champaign Rd
Lincoln Park, MI 48146
4,906
Students enrolled in District
11
Schools in District
15
Students Per Classroom
(State average is 17)
Lincoln Park School District Of The City Of School District School Quality Ratings
District
Quality
Compared to Michigan
3
(10
is best)
District
Quality
Compared to U.S.
The Only Nationally Comparable School Quality Ratings Available Today
U.S. Patent 8,376,755 by NeighborhoodScout®
NeighborhoodScout® has developed the first ever nationally comparable school ratings.
The result? - neighborhood educational ratings that facilitate accurate comparison among schools, school districts, and neighborhoods in the same (or different) cities, and even between schools in different states.
It is well known that the quality of education provided by public schools varies greatly from school district to school district, and from city to city. Still further, the quality of a child's education can vary significantly from neighborhood to neighborhood within any city or town.