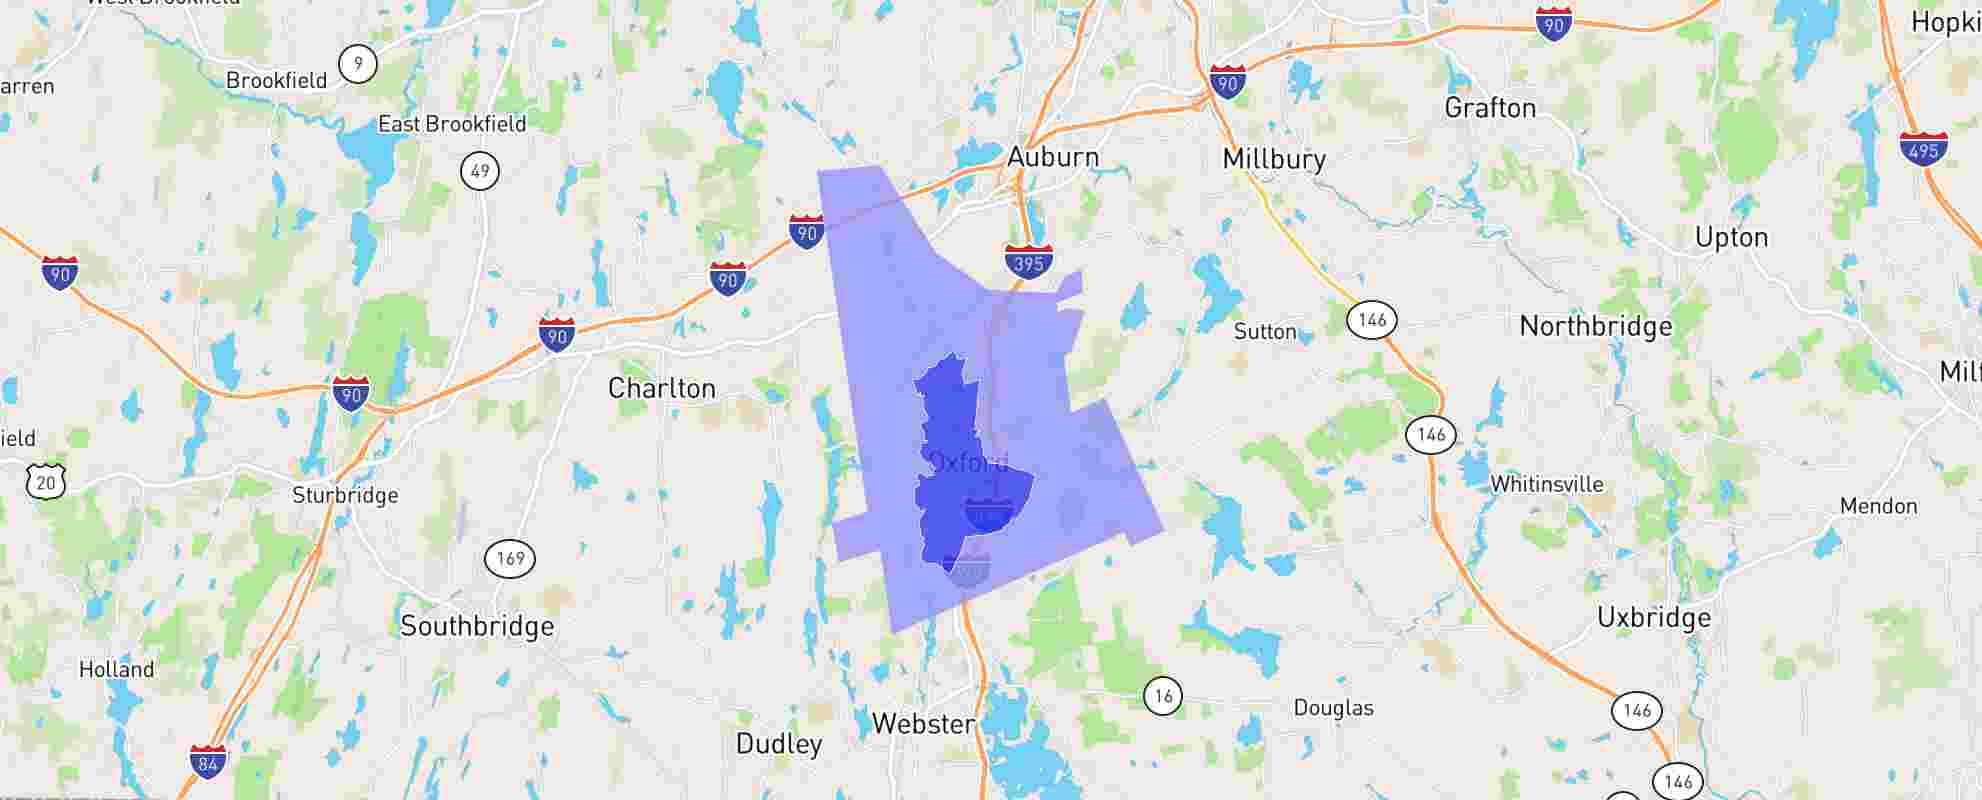
Data on this report is based on areas within the legal city boundary, outlined in black on the map. Any additional neighborhoods shown on the map are associated with the city by name and are included for reference only.
Raw data sources:
18,000 local law enforcement agencies in the U.S.
Date(s) & Update Frequency:
Reflects 2023 calendar year; released from FBI in October 2024 (latest available). Updated annually.
Where is 2024 data?
Methodology:
Our nationwide meta-analysis overcomes the issues inherent in any crime database, including non-reporting and reporting errors. This is possible by associating the 9.4 million reported crimes in the U.S, including over 2 million geocoded point locations….
Read more about Scout's Crime Data
Oxford has an overall crime rate of 10 per 1,000 residents, making the crime rate here near the average for all cities and towns of all sizes in America. According to our analysis of FBI crime data, your chance of becoming a victim of crime in Oxford is 1 in 98. How does Oxford fare compared to other communities in Massachusetts of all population sizes? Oxford's crime rate is lower than approximately 35% of Massachusetts communities.
However, compared to other communities of similar population size, Oxford has a crime rate that is noticeably lower than the average. This means that for comparably sized cities all across America, Oxford is actually safer than most according to NeighborhoodScout's exclusive analysis of FBI crime data.
Now let us turn to take a look at how Oxford does for violent crimes specifically, and then how it does for property crimes. This is important because the overall crime rate can be further illuminated by understanding if violent crime or property crimes (or both) are the major contributors to the general rate of crime in Oxford.
NeighborhoodScout's research shows that Oxford's violent crime rate is 1 per one thousand inhabitants, which is about average for all communities in America, across all population sizes. Violent crimes that are tracked and included in this rate are armed robbery, aggravated assault, rape (not statutory), and murder and non-negligent manslaughter. Roughly similar to the national average, our analysis shows that your chance of becoming a victim of violent crime in Oxford is one in 1109.
NeighborhoodScout's analysis also reveals that Oxford's rate for property crime is 9 per one thousand population. This makes Oxford a place where there is an above average chance of becoming a victim of a property crime, when compared to all other communities in America of all population sizes. Property crimes are motor vehicle theft, arson, larceny, and burglary. Your chance of becoming a victim of any of these crimes in Oxford is one in 107.
Oxford Crime
Data
FAQ on NeighborhoodScout's Crime Data
NeighborhoodScout® provides exclusive crime risk analytics for every neighborhood in America with up to 98% predictive accuracy. Crime risk indices are nationally comparable on a 1 – 100 scale, where 100 means safer than 100% of U.S. neighborhoods.
Crime risk data are updated annually. Raw crime incidents are sourced from all 18,000+ local law enforcement agencies – municipal, county, transit, park, port, university, tribal and more, assigned to localities, then built into NeighborhoodScout’s proprietary predictive models to provide a comprehensive crime risk profile for every neighborhood and address-vicinity in the U.S.