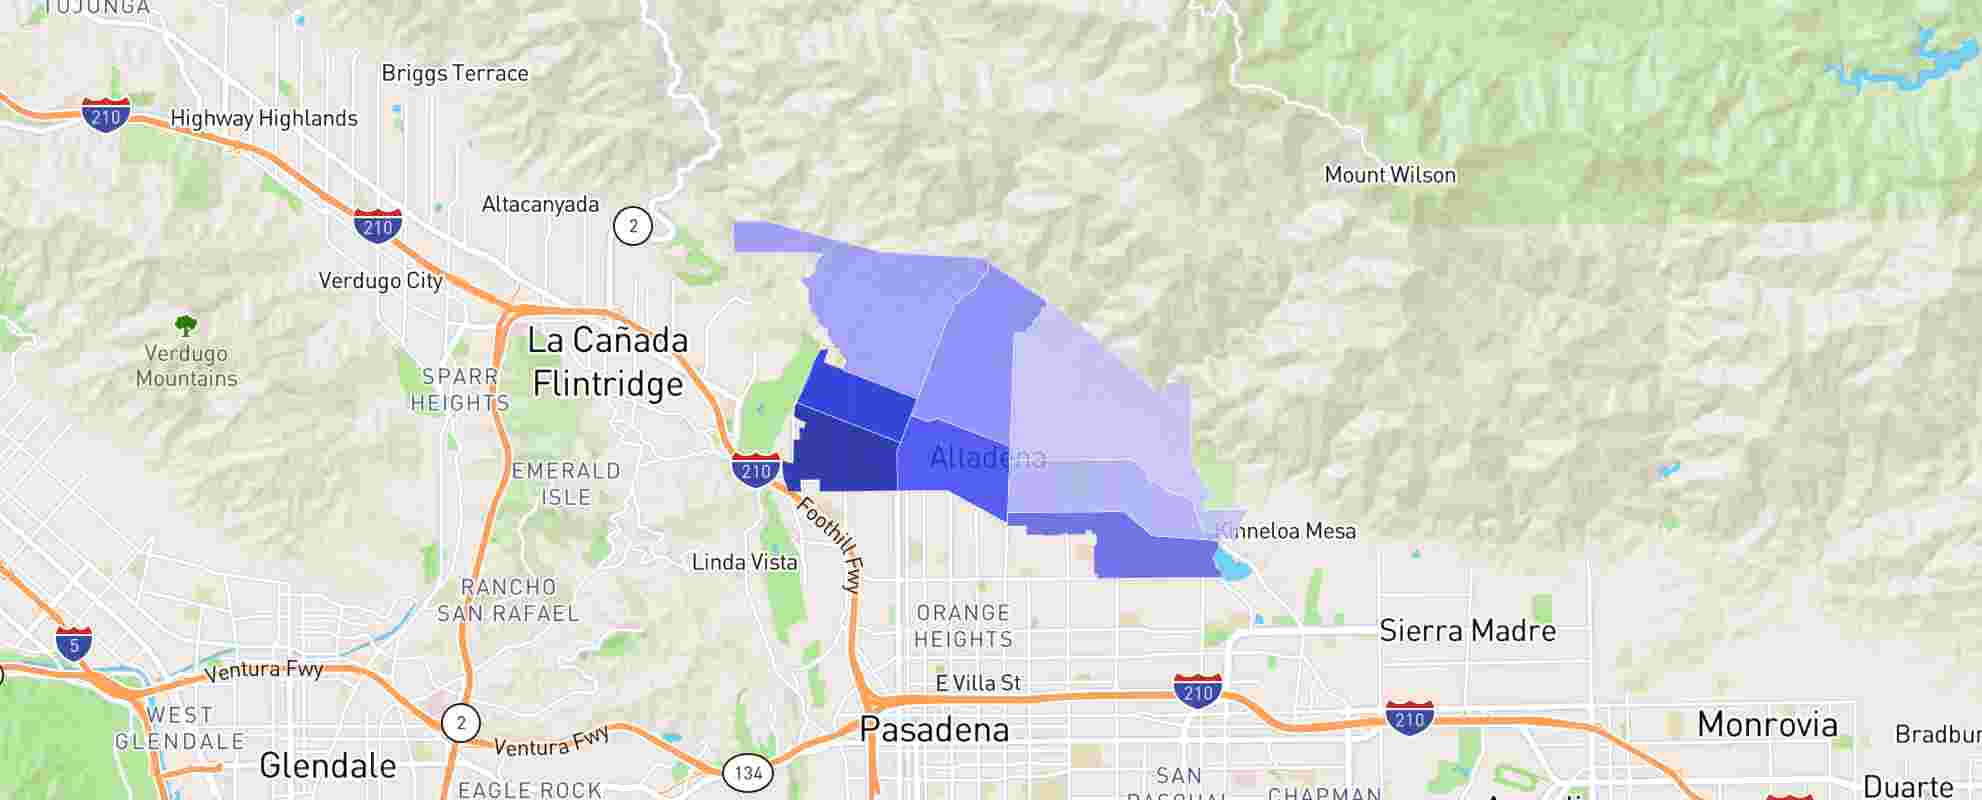
Data on this report is based on areas within the legal city boundary, outlined in black on the map. Any additional neighborhoods shown on the map are associated with the city by name and are included for reference only.
Raw data sources:
18,000 local law enforcement agencies in the U.S.
Date(s) & Update Frequency:
Reflects 2023 calendar year; released from FBI in October 2024 (latest available). Updated annually.
Where is 2024 data?
Methodology:
Our nationwide meta-analysis overcomes the issues inherent in any crime database, including non-reporting and reporting errors. This is possible by associating the 9.4 million reported crimes in the U.S, including over 2 million geocoded point locations….
Read more about Scout's Crime Data
The crime rate in Altadena is considerably higher than the national average across all communities in America from the largest to the smallest, although at 22 crimes per one thousand residents, it is not among the communities with the very highest crime rate. The chance of becoming a victim of either violent or property crime in Altadena is 1 in 45. Based on FBI crime data, Altadena is not one of the safest communities in America. Relative to California, Altadena has a crime rate that is higher than 69% of the state's cities and towns of all sizes.
Importantly, when you compare Altadena to other communities of similar population, then Altadena crime rate (violent and property crimes combined) is quite a bit higher than average. Regardless of how Altadena does relative to all communities in America of all sizes, when NeighborhoodScout compared it to communities of similar population size, its crime rate per thousand residents stands out as higher than most.
Now let us turn to take a look at how Altadena does for violent crimes specifically, and then how it does for property crimes. This is important because the overall crime rate can be further illuminated by understanding if violent crime or property crimes (or both) are the major contributors to the general rate of crime in Altadena.
For Altadena, we found that the violent crime rate is one of the highest in the nation, across communities of all sizes (both large and small). Violent offenses tracked included rape, murder and non-negligent manslaughter, armed robbery, and aggravated assault, including assault with a deadly weapon. According to NeighborhoodScout's analysis of FBI reported crime data, your chance of becoming a victim of one of these crimes in Altadena is one in 172.
NeighborhoodScout's analysis also reveals that Altadena's rate for property crime is 16 per one thousand population. This makes Altadena a place where there is an above average chance of becoming a victim of a property crime, when compared to all other communities in America of all population sizes. Property crimes are motor vehicle theft, arson, larceny, and burglary. Your chance of becoming a victim of any of these crimes in Altadena is one in 61.
Importantly, we found that Altadena has one of the highest rates of motor vehicle theft in the nation according to our analysis of FBI crime data. This is compared to communities of all sizes, from the smallest to the largest. In fact, your chance of getting your car stolen if you live in Altadena is one in 242.
Altadena Crime
Data
FAQ on NeighborhoodScout's Crime Data
NeighborhoodScout® provides exclusive crime risk analytics for every neighborhood in America with up to 98% predictive accuracy. Crime risk indices are nationally comparable on a 1 – 100 scale, where 100 means safer than 100% of U.S. neighborhoods.
Crime risk data are updated annually. Raw crime incidents are sourced from all 18,000+ local law enforcement agencies – municipal, county, transit, park, port, university, tribal and more, assigned to localities, then built into NeighborhoodScout’s proprietary predictive models to provide a comprehensive crime risk profile for every neighborhood and address-vicinity in the U.S.