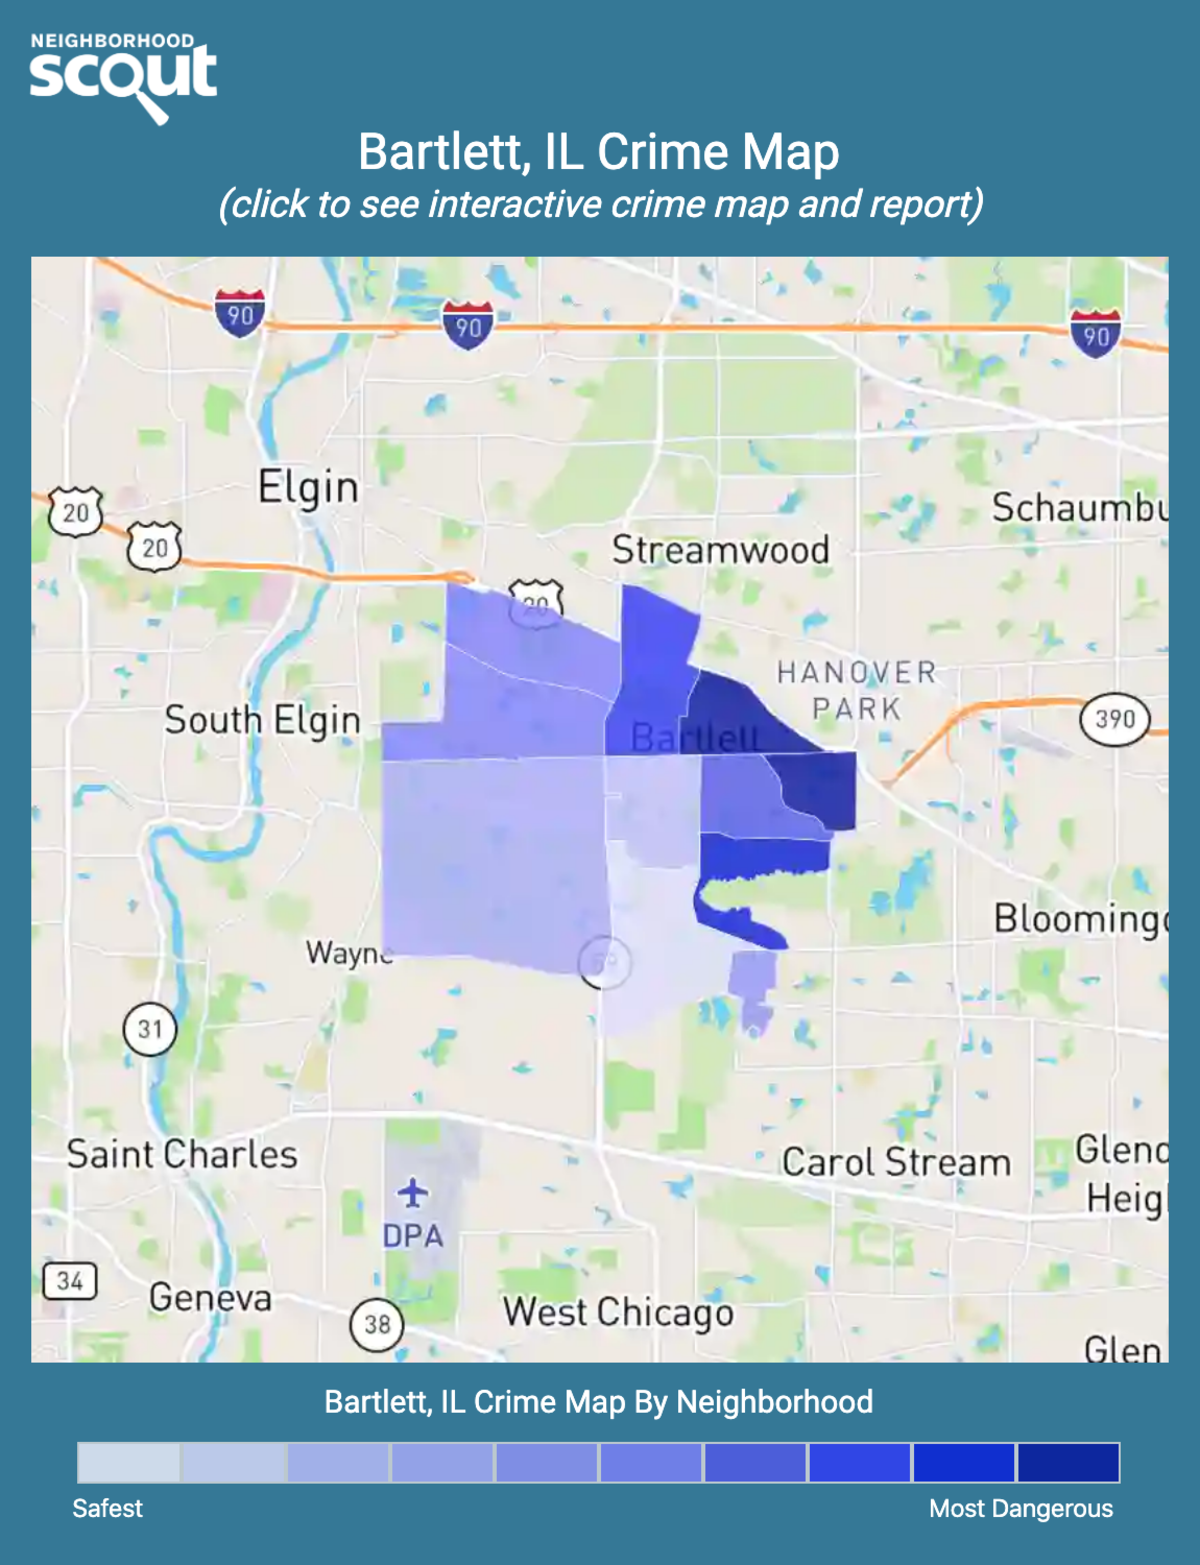
Data on this report is based on areas within the legal city boundary, outlined in black on the map. Any additional neighborhoods shown on the map are associated with the city by name and are included for reference only.
Raw data sources:
18,000 local law enforcement agencies in the U.S.
Date(s) & Update Frequency:
Reflects 2022 calendar year; released from FBI in Oct. 2023 (latest available). Updated annually.
Where is 2023 data?
Methodology:
Our nationwide meta-analysis overcomes the issues inherent in any crime database, including non-reporting and reporting errors. This is possible by associating the 9.4 million reported crimes in the U.S, including over 2 million geocoded point locations….
Read more about Scout's Crime Data
Bartlett's overall rate of crime is sufficiently low that NeighborhoodScout's analysis shows the village to be one of the safest in both Illinois and the nation. Bartlett's crime rate is just 1 per 1,000 people, which means that a person's chance of becoming a victim in Bartlett is one in 854.
Additionally, NeighborhoodScout analyzed all cities and towns in America with a similar population size to Bartlett, and we found that the crime rate in Bartlett is one of the lowest in the nation for its size. This means Bartlett is one of the safest places in America in which to live for its size, a very important finding.
Now let us turn to take a look at how Bartlett does for violent crimes specifically, and then how it does for property crimes. This is important because the overall crime rate can be further illuminated by understanding if violent crime or property crimes (or both) are the major contributors to the general rate of crime in Bartlett.
For Bartlett, NeighborhoodScout found that the violent crime rate is well below the national average for all communities of all population sizes. Violent crimes such as assault, rape, murder and armed robbery happen less often in Bartlett than in most of America. One's chance of becoming a victim of a violent crime here is one in 5736, which is a violent crime rate of 0 per one thousand inhabitants.
Furthermore, our research shows that motor vehicle theft, arson, burglary, and larceny are not very common in Bartlett compared to most US cities and towns. In fact, the rate of these property crimes in Bartlett is just 1 per one thousand people, far below the national average. Based on this rate, Bartlett is one of the safer communities in America with regard to incidences of property crime.
Bartlett Crime
Data
FAQ on NeighborhoodScout's Crime Data
NeighborhoodScout® provides exclusive crime risk analytics for every neighborhood in America with up to 98% predictive accuracy. Crime risk indices are nationally comparable on a 1 – 100 scale, where 100 means safer than 100% of U.S. neighborhoods.
Crime risk data are updated annually. Raw crime incidents are sourced from all 18,000+ local law enforcement agencies – municipal, county, transit, park, port, university, tribal and more, assigned to localities, then built into NeighborhoodScout’s proprietary predictive models to provide a comprehensive crime risk profile for every neighborhood and address-vicinity in the U.S.